JavaMelody v1.56.0 发布,系统监控工具
发布于 2015-05-03 01:22:03 | 222 次阅读 | 评论: 0 | 来源: 网友投递
JavaMelody 系统监控工具
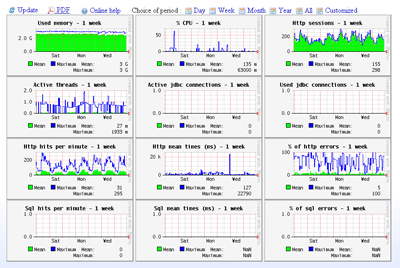
JavaMelody是一个系统监控工具 , 能够监测Java或Java EE应用程序服务器,并以图表的方式显示:Java内存和Java CPU使用情况,用户Session数量,JDBC连接数,和http请求、sql请求、jsp页面与业务接口方法(EJB3、Spring、 Guice)的执行数量,平均执行时间,错误百分比等。图表可以按天,周,月,年或自定义时间段查看。
JavaMelody v1.56.0 发布,此版本现已提供下载:
-
如果使用 Maven,要在 pom.xml 添加依赖:
        <dependency>
                <groupId>net.bull.javamelody</groupId>
                <artifactId>javamelody-core</artifactId>
                <version>1.56.0</version>
        </dependency>
此版本改进内容如下:
-
fix issue 476 : ClassLoader leak when using the reports and then hot-redeploy with Tomcat 7.0.42 or later
-
fix issue 475 : IllegalAccessException when creating Jdbc Proxy (Java 8)
-
fix issue 473 : Basic Authentication and Sessions
-
fix issue 460 : In WildFly 8.2, "ClassNotFoundException: Can't find a delegate" when monitoring JPA
-
fix issue 477 : In the processes list, CPU and Command are sometimes in the wrong column
-
added: MULTILINE & DOTALL flags for transform-patterns regexps ( issue 474 , thanks to Michal Bergmann).
-
doc added: Example of embedding JavaMelody in a standalone application (non webapp), thanks to Philip Zeyliger and let4time
-
doc updated: Examples of web.xml and of context-param updated in the user's guide to be sure that parameters are not ignored in some case of webapp v3.1 with JDK8 ( issue 459 ).
-
Sources from SVN are now mirrored in Github: https://github.com/evernat/javamelody. The Github mirror is synchronized once a day by this Jenkins job. (This mirror does not include Jenkins, Liferay, Grails and Sonar plugins.)
-
Contributors to code can fork the github mirror repository and submit pull requests: the diff of the PR will be merged into SVN. Or contributors can still checkout from SVN and submit patches in issues as before.
JavaMelody 能够监测Java或Java EE应用程序服务器,并以图表的方式显示:Java内存和Java CPU使用情况,用户Session数量,JDBC连接数,和http请求、sql请求、jsp页面与业务接口方法(EJB3、Spring、 Guice)的执行数量,平均执行时间,错误百分比等。图表可以按天,周,月,年或自定义时间段查看。
JavaMelody是一个系统监控工具 , 能够监测Java或Java EE应用程序服务器,并以图表的方式显示:Java内存和Java CPU使用情况,用户Session数量,JDBC连接数,和http请求、sql请求、jsp页面与业务接口方法(EJB3、Spring、 Guice)的执行数量,平均执行时间,错误百分比等。图表可以按天,周,月,年或自定义时间段查看。

历史版本 :
JavaMelody 1.70.0 发布,Java 应用监控平台
JavaMelody 1.69.0 发布,Java 应用监控平台
JavaMelody 1.68.1 发布,Java 应用监控平台
JavaMelody 1.68.0 发布,Java 应用监控平台
JavaMelody v1.67.0 发布,系统监控平台
JavaMelody v1.66.0 发布,系统监控平台
JavaMelody v1.65.0 发布,系统监控平台
JavaMelody v1.64.0 发布,系统监控平台
JavaMelody v1.63.0 发布,系统监控平台
JavaMelody v1.62.0 发布,系统监控平台
JavaMelody v1.61.0 发布,系统监控平台
JavaMelody v1.60.0 发布,系统监控平台