Visual Studio Code 1.8 发布
发布于 2016-12-15 05:01:15 | 306 次阅读 | 评论: 0 | 来源: 网友投递
Visual Studio Code 跨平台编辑器
Visual Studio Code 是一个运行于 OS X,Windows 和 Linux 之上的,针对于编写现代 web 和云应用的跨平台编辑器。该应用仍然处于预览版阶段,但是你现在就可以在这里下载体验。
欢迎来到 Visual Studio Code 的 11 月份更新. 在这个版本中有很多重要的更新,希望你们会喜欢,一些主要的亮点更新包括:
-
Hot Exit - 快速切换上下文且永不不丢失更改
-
Focus on Your Code - Zen 模式、可配置活动栏等功能增强
-
Settings improvements - 配置 VS 代码的新体验
-
New Selection menu - 轻松发现和使用编辑器选择命令
-
Faster Text Search - 无论项目有多大,都能快速找到代码
-
Snippet authoring - 在代码段中使用变量
-
Keyboard shortcuts - 使用命令参数创建自定义快捷方式,找到热门的 Keymaps
-
JavaScript IntelliSense in HTML - 在 HTML 文件中获得完整的 JavaScript 语言支持
-
UI for Multitarget Debugging - 启动同时调试会话
-
TypeScript 2.1 - 使用最近更新的 TypeScript 并改进了语言支持
-
JavaScript - 支持 Object Rest/Spread
The release notes are arranged in the following sections related to VS Code focus areas. Here are some further updates:
-
Workbench - 新视图选择器,集成终端改进,macOS 主题标题
-
Settings - 搜索并轻松编辑设置,找到键盘映射扩展
-
Editor - Git Clone,新编辑器设置,Sublime Text 兼容性
-
Languages - CSS 应用规则、Markdown 自定义预览、TSLint 和 ESLint 扩展更新。
-
Debugging - 通过 IntelliSense 轻松添加启动配置作为片段
-
Node.js Debugging - Just My Code, load environment variables from files, help for sourcemaps.
-
Extension Authoring - 严格的空检查、片段完成、调试器扩展更新。
Workbench
Hot Exit
VS Code now remembers your unsaved changes when you exit. Hot Exit will be triggered under the following cases:
-
All windows (instances) are closed.
-
On Mac, when you finally quit the application.
-
Window reload, no more saving to reload extensions!
When VS Code is next launched after a Hot Exit, all workspaces/files that are backed up will be restored. This also brings with it the ability to restore files if VS Code crashes, regardless of whether Hot Exit is enabled or disabled (via the files.hotExit setting). You can read more about how Hot Exit works, the design decisions behind the implementation, and what's next for the feature on our blog.
View Picker
A new picker is added that shows Views, Panels, Output channels and Terminals and allows for easy opening of those. You can open it via the Open View command or by typing view followed by a spaceinto Quick Open.
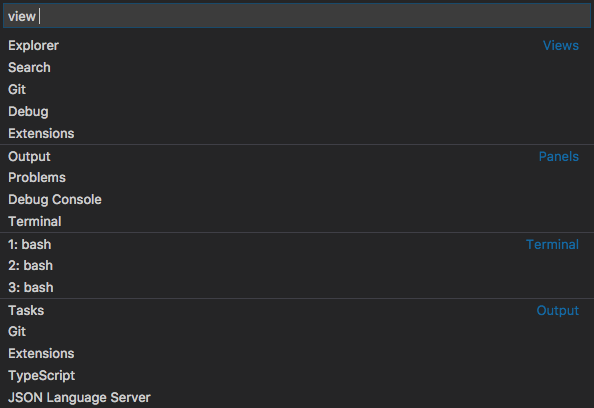
On Windows and Mac, you can press Ctrl+Q to bring up the picker. On Linux, you can reassign the key binding if you want (Ctrl+Q is assigned to quitting on Linux). Pressing Ctrl+Q and holding the Ctrlkey while pressing the Q allows you to jump to an entry from the list and open it after you release the keys.
Terminal improvements
Several improvements were made to the Integrated Terminal:
-
Terminal copy and paste key bindings on Windows have changed to Ctrl+C (when text is selected) and Ctrl+V respectively.
-
The terminal will no longer scroll to the bottom when it receives output if you have scrolled up
-
Cmd+K now clears the terminal when it has focus
-
A new setting terminal.integrated.scrollback enables changing the number of lines the terminal will remember before discarding
Mac: Custom themed title
On macOS, we are now drawing our own custom title instead of the native one to allow for the theme color to be picked up. This behavior can be changed with the new window.titleBarStyle setting. The new default is custom but you can set the value to native to go back to the old behavior after a restart.
Focus on your code
This release we've added features to help you focus on your highest priority, your source code.
Zen Mode
Per user requests, we have added Zen Mode to VS Code. Zen Mode lets you focus on your code by hiding all UI except the editor (no Activity Bar, Status Bar, Sidebar and Panel) and going to full screen. Zen mode can be toggled using the View menu, Command Palette or by the shortcut ⌘K Z. If you prefer not to transition to full screen, that can be disabled via workbench.fullScreenZenMode. Double Escape exits Zen Mode.
Configurable Activity Bar
The Activity Bar is home to all views shipped with VS Code (File Explorer, Search, Debug). Many people use it to quickly switch between views and to see information about a view (for example, the number of outgoing files on the Git view).
In this release, we improved the Activity Bar with several new features. First of all, it is now possible to reorder views using drag and drop. The order is kept and restored between restarts of VS Code. Second, you can now remove entries from the Activity Bar using the context menu on either the Activity Bar itself or the particular view to remove.
Removed views will still show up in the Activity Bar when opened but their icon will not be displayed when you switch to another view. This is similar to the well-known behavior of an application dock where you can pin applications to always show them or unpin them if you want the application icon to be removed once the application quits.

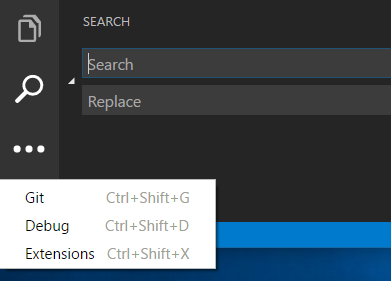
Finally, if the window gets small enough so that all view icons cannot show, a new overflow menu was added to show the views in a dropdown:
Hide the Activity Bar
A new setting workbench.activityBar.visible lets you hide the Activity Bar to the side of the view area.

We also added a related entry to the View menu as well as in Command Palette. The related command has the id workbench.action.toggleActivityBarVisibility.
New setting to hide Close buttons on Tabs
We added a new setting workbench.editor.showTabCloseButton that will hide the Close buttons on tabs. Dirty indications are still visible at the same location but you will not accidentally close tabs with the mouse once enabled.
Settings
VS Code's customization model is very simple in the form of a settings.json file which you edit to configure VS Code's behavior. To discover available settings, we show Default Settings in a separate editor as well as provide IntelliSense in your opened global or workspace settings. From user feedback and usability studies, we learned that people were still having trouble working with their settings. In this release, we did some explorations to improve discoverability and the user experience for modifying settings and this resulted in the following improvements.
Search settings
One of the big reasons for showing the default settings is to let users search and discover settings. To facilitate this, the Default Settings editor now comes with a big Search bar where you can easily search for settings. In addition to showing and highlighting settings matching your search criteria, this will also filter out those settings which are not matching. This makes finding settings quick and easy.

Settings groups
We enhanced visual representation of Default Settings groups to make settings navigation more user friendly. We also introduced a new group of most commonly used settings.

Quick Edit
We introduced actions inside the Default Settings and settings.json editors which will help you quickly copy or update a setting.

One Side by Side Settings editor
Last but not least, we grouped the Default Settings and settings.json editors into one side by side editor. This addresses the issue of managing two editors for settings.
Explorations and improvements continue... Stay tuned to our next release plan.
Keyboard shortcuts
Key binding command arguments
We added support to invoke commands with arguments to the keybindings.json configuration file. This is useful if you often perform the same operation on a specific file or folder. Simply add a custom keyboard shortcut to do exactly what you want.
The following is an example overriding the Enter key to print some text:
{ "key": "enter", "command": "type", "args": { "text": "Hello World" }, "when": "editorTextFocus" }
The type command will receive { "text": "Hello World"} as first argument and add "Hello World" to the file instead of producing the default command.
Recommended keymap extensions
We have added a command to list the most popular Keymap extensions which provide full sets of key bindings for popular editors or IDEs. To see the list, use File > Preferences > Keymap Extensions.

Editor
Selection menu
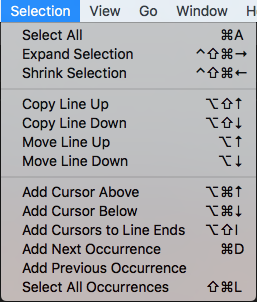
We have added a Selection menu to the menu bar giving access to the most common selection and multi-selection actions:
Text search performance
We improved the performance of full text search by running our search code in multiple processes in parallel. Your searches should complete much faster, especially in large workspaces.
Git clone
There is now a new lightweight command to clone a Git repository into your machine and open it with VS Code. You can execute it from the Command Palette and searching for Git: Clone.
New editor settings
-
window.showFullPath - show the full path to an opened file in the window title instead of the workspace relative one.
-
files.insertFinalNewline - automatically add a newline at the end of files when saving.
The editor.renderLineHighlight setting has been updated to support new options:
-
line - Highlight the current line in the editor.
-
gutter - Highlight the line number in the gutter to the left of the current line.
-
all - Both gutter and line highlight.
-
none - No current line highlighting.

Accessibility improvements of diff editor
We enhanced the accessibility of the diff editor by adding + and - indicators for modifications in the diff editor. The feature is enabled by default and can be disabled by setting diffEditor.renderIndicatorsto false.

Sublime Text compatibility
We added four new commands which users from Sublime Text are familiar with:
-
Join Lines - editor.action.joinLines
-
Transpose characters around the cursor - editor.action.transpose
-
Transform to Uppercase - editor.action.transformToUppercase
-
Transform to Lowercase - editor.action.transformToLowercase
These commands are not bound to any keyboard shortcuts by default.
Snippets
Snippet Variables
In your custom snippets, you can now use variables. The syntax for variables is $name for simple variables and ${name:default} for variables with a default value. Variables evaluate to their value, the empty string, or, if present, their default value. When a variable is unknown, we insert it as a placeholder.
The following variables can be used:
-
TM_SELECTED_TEXT - The currently selected text or the empty string.
-
TM_CURRENT_LINE - The contents of the current line.
-
TM_CURRENT_WORD - The contents of the word under cursor or the empty string.
-
TM_LINE_INDEX - The zero-index based line number.
-
TM_LINE_NUMBER - The one-index based line number.
-
TM_FILENAME - The filename of the current document.
-
TM_DIRECTORY - The directory of the current document.
-
TM_FILEPATH - The full file path of the current document.
The following is an example of a snippet that surrounds the selected text with single quotes or, when no text is selected, inserts a type_here-placeholder.
"in quotes": { "prefix": "inq", "body": "'${TM_SELECTED_TEXT:${1:type_here}}'" }
Snippets in JSON schemas
The JSON language service uses JSON schemas to validate JSON documents as well as to provide completions. As a VS code specific extension to JSON schemas, you can now also specify snippets proposals in the schema for a richer experience. The snippet proposals are shown as additional completion proposals and use the snippet syntax to specify placeholders. See the JSON documentationfor more information.
Languages
JavaScript language support in HTML
Coding assistance for JavaScript embedded in HTML is back! You get code completions and signature help for DOM and JQuery APIs, validation, hovers, Find References and Go To Definition, symbol highlighting and outline (Ctrl + Shift + o) and format. Note that the language support doesn't follow script includes, it only knows about definitions made in the same file.

CSS improvements
The CSS language support can now handle the new @apply rule.
CSS in HTML was also improved, in particular for styles defined in attributes:

TypeScript Update
We now use TypeScript 2.1 for JavaScript and TypeScript language support. TypeScript 2.1 brings a number of new language and tooling features. Read about what's new in TypeScript 2.1.
JavaScript
The JavaScript in VS Code is powered by TypeScript and the new TypeScript version bundled with VS Code brings several improvements for JavaScript support:
-
Support for Object Rest and Spread. This was a heavily requested feature request by JS developers working with React. Now you no longer need to disable JavaScript validation when using Object Spread/Rest.
-
Configuration inheritance for jsconfig.json files.
-
IntelliSense for paths in import and require.
Markdown preview improvements
Several new settings were added to improve Markdown preview and let you more closely match your final Markdown rendering.
-
markdown.previewFrontMatter - By default, VS Code now hides YAML front matter sections in preview. You can set to show if you'd like to review YAML metadata.
Controls the font family, size and line height used in the Markdown preview.
-
markdown.preview.fontFamily
-
markdown.preview.fontSize
-
markdown.preview.lineHeight
Linter Extensions
VSCODE-TSLINT
The vscode-tslint extension now supports TSLint 4.0. This version of TSLint provides additional quick fixes for warnings. In addition, vscode-tslint adds a quick fix to disable a TSLint rule on the next line. The new TSLint version also adds support for linting JavaScript files. See the CHANGELOG for more details.
VSCODE-ESLINT
The vscode-eslint extension now supports validating file types other than JavaScript. To enable this, you need to do the following:
-
Configure ESLint with an additional plugin to do the actual validation. For example, to validate HTML files install eslint-plugin-html using npm install eslint-plugin-html and update the eslint configuration (e.g. .eslintrc.json file) with "plugin": [ "html" ].
-
Add the corresponding language identifier to the eslint.validate setting. Something like "eslint.validate": [ "javascript", "javascriptreact", "html" ]. If the setting is missing, it defaults to ["javascript", "javascriptreact"]
Debugging
Multitarget debugging
A first glimpse of multi-target debugging was already available in the previous milestone. In this milestone, we've added the user interface for it. With this release, multi-target debugging is no longer experimental.
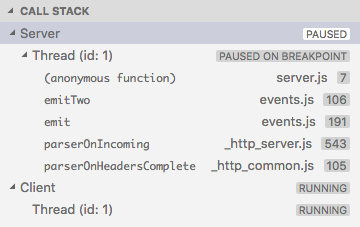
Using multi-target debugging is very simple: after you've started a first debug session, VS Code no longer blocks you from launching another session. As soon as a second session is up and running, the VS Code UI switches to multi-target mode:
-
The individual sessions now show up as top level elements in the CALL STACK view.
-
The floating debug widget shows the currently active session (and all other sessions are available in a dropdown menu).

-
Debug actions (e.g. all actions in the floating debug widget) are performed on the active session. The active session can be changed either by using the drop down menu in the floating debug widget or by selecting a different element in the CALL STACK view.
-
Whenever a session stops (e.g. because a breakpoint or exception is hit), this session becomes the active session. This makes it possible to easily step between debug sessions just by pressing 'F5'.
An alternative way to start multiple debug session is by using a so-called compound launch configuration. A compound launch configuration lists the names of two or more launch configurations that should be launched in parallel. Compound launch configurations show up in the launch configuration drop down menu.
{ "version": "0.2.0", "configurations": [ { "type": "node", "request": "launch", "name": "Server", "program": "${workspaceRoot}/server.js", "cwd": "${workspaceRoot}" }, { "type": "node", "request": "launch", "name": "Client", "program": "${workspaceRoot}/client.js", "cwd": "${workspaceRoot}" } ], "compounds": [ { "name": "Server/Client", "configurations": ["Server", "Client"] } ] }
This blog explains in detail how to setup a compound configuration for a Node.js backend and a browser frontend.
Adding individual Launch Configurations
We've tried to improve the experience of adding new configurations to an existing launch.json by supporting snippet suggestions for IntelliSense. Snippet IntelliSense is available if your cursor is located inside the configurations array. Or just press the Add Configuration button to invoke snippet IntelliSense at the start of the array.

IntelliSense lists the launch configuration snippets that are contributed by all installed debug extensions. This makes it really easy to combine launch configurations for different debuggers (e.g. Chrome and Node) into one launch.json.
Since debug extensions will have to opt into this new feature, please allow some time until all debuggers have adopted this. In the November release, only the built-in Node.js debuggers contribute snippets.
Some UI Polish
Per user request, we now support rearranging the order of Watch expressions using drag and drop.
We have polished the look of the debug start action UI by grouping the start button with the drop down menu to tie them together:

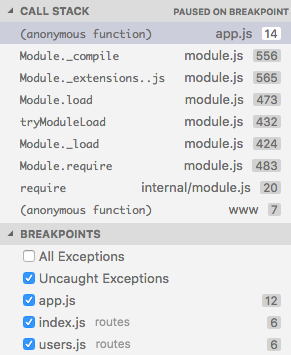
The source and line number information in the BREAKPOINTS view has been rearranged to better align with the CALL STACK view.
Node Debugging
This section covers features of the two built-in Node.js debuggers, node and node2. We try to keep feature parity between them but this becomes more and more difficult because the technology underlying node (V8 Debugger Protocol) is deprected (frozen) whereas the new technology (Chrome Debugger Protocol) evolves quickly. For this reason, we list the supported debugger types in parenthesis in the header of each feature.
Use the 'old' debugger node when debugging Node.js versions < 6.3 and the new debugger node2 for versions >= 6.3.
Note: If you are using ES6 Proxy in your Node.js app, a Node.js v7.x runtime might even crash when being debugged by the old debugger. This does not happen with node2. This issue is tracked in Microsoft/vscode#12749.
Just My Code (node and node2)
We have added a feature to avoid code that you don't want to step through. This feature can be enabled with the skipFiles setting in your launch configuration. skipFiles is an array of glob patterns for script paths to skip.
For example using:
"skipFiles": [ "node_modules/**/*.js", "lib/**/*.js ]
all code in the node_modules and lib folders will be skipped.
The exact rules are as follows:
-
If you step into a skipped file, you won't stop there - you will stop on the next executed line that is not in a skipped file.
-
If you have set the option to break on thrown exceptions, then you won't break on exceptions thrown from skipped files.
-
If you set a breakpoint in a skipped file, you will stop at that breakpoint, and you will be able to step through it until you step out of it, at which point normal skipping behavior will resume.
This feature is available in the node, node2, and Chrome debuggers.
Note: The old debugger (node) supports negative glob patterns, but they must follow a positive pattern: positive patterns add to the set of skipped files, while negative patterns subtract from that set.
In the following example all but a 'math' module is skipped:
"skipFiles": [ "node_modules/**/*.js", "!node_modules/math/**/*.js", ]
Note: The old debugger (node) has to emulate the Just My Code feature because the V8 Debugger Protocol does not support it natively. This might result in slow stepping performance.
Load environment variables from external file (node)
The VS Code Node debugger now supports to load environment variables from a file and passes them to the node runtime. To use this feature add an attribute envFile to your launch config and specify the absolute path to the file containing the environment variables:
//... "envFile": "${workspaceRoot}/.env", "env": { "USER": "john doe" } //...
Any environment variable specified in the env dictionary will override variables loaded from the file.
Here is an example for an '.env' file:
USER=doe PASSWORD=abc123 # a comment # an empty value: empty= # new lines expanded in quoted strings: lines="foonbar"
Diagnostics for Source Map Problems (node2)
When debugging a Node.js app, you may have seen breakpoints turn gray with the message "Source map problem?". The new node2 debug adapter has two new features which make it easier to understand these issues.
Typing .scripts in the debug console during a debugging session will cause the adapter to print out all the information it has about loaded scripts and their sourcemaps.
And the sourceMapPathOverrides option in the launch config allows you to rewrite paths in your sourcemap file to enable sourcemaps in cases where the sourcemap file doesn't include enough information for the debug adapter to find the correct source files on disk. See more information about both of these features in the node2 README.
Back in time Debugging (node)
This UI appears automatically for Chakra based Node.js runtimes. For details see this blog.
The Back In Time Debugging support of the node debugger has been extended by a Reverse Continue action:

Extension Authoring
Strict Null Checks supported
We have updated the type definitions in vscode.d.ts to explicit spell out when a type can be undefined and/or null. With this extensions using the strictNullChecks-feature of TypeScript will get better type check results.
Snippet Completions
A completion item provider can now return completions that are inserted as snippet. When creating an item, make sure its insertText is a SnippetString. When selected, the editor will go to snippet mode, allowing the have placeholders and control over the cursor position.
Inspect Configurations
With the new inspect-function you can figure out where a configuration value was defined and what it default is.
TextDocument#getWordRangeAt
Ever since the text document allows to ask for a word-range at a given position. To know what a word is VS Code uses the word-pattern of the respective language. That's not always good enough and therefore you can now provide a regular expression that will be used instead.
Debugger Extension Authoring
In the launch.json, the top level debugServer attribute has been deprecated (and support for it will be removed in the February milestone). Instead the debugServer attribute has to be specified per launch configuration. More details can be found here.
Debugger extensions can now contribute launch configuration snippets which will get surfaced in launch.json as explained in section "Adding Individual Launch Configurations". This can be done using the regular syntax for contributing snippets to VS Code, but as a configurationSnippets attribute inside the debuggers section of the package.json. An example of how Mock Debug is contributing debug configuration snippets can be found here.
VS Code Debug Protocol
The OutputEvent type now supports to send structured objects to the debug console and VS Code renders them as expandable objects. More details can be found here.
A new RestartRequest has been added to the debug protocol. If a debug adapter opts into this, the VS Code debugger UI no longer implements the Restart action by terminating and restarting the debug adapter but instead sends a RestartRequest to the adapter. More details can be found here.
Miscellaneous
Electron update
In this release, we updated from Electron 1.3.x to 1.4.x. This brings a Chrome update from version 52 to 53. We have heard from users that this update reduces font blurriness on Windows when running with >100% DPI.
Another benefit is that we can now enable the High Contrast theme automatically when we detect that Windows is running in high contrast mode. VS Code will open in high contrast mode when Windows is configured as such and will also switch to high contrast mode if you change the mode in Windows while VS Code is running.
Language Server Protocol
The LSP now supports snippets in completion items just as the VS Code API does. In addition, two new requests got introduced supporting the dynamic registration of providers on the client side. Also the LSP NPM node modules were upgraded to TypeScript version 2.0. For details see
https://github.com/Microsoft/language-server-protocol and https://github.com/Microsoft/vscode-languageserver-node
New Commands
| Key | Command | Command id |
|---|---|---|
| ⌃Q | Quick Open View | workbench.action.quickOpenView |
| unassigned | Open Next Editor in Group | workbench.action.nextEditorInGroup |
| unassigned | Open Previous Editor in Group | workbench.action.previousEditorInGroup |
| ⌘K Z | Enable Zen Mode | workbench.action.toggleZenMode |
| Escape Escape | Leave Zen Mode | workbench.action.exitZenMode |
| unassigned | Close active Panel | workbench.action.closePanel |
| unassigned | Clone from a Git URL | workbench.action.git.clone |
| unassigned | Toggle Visibility of Activity Bar | workbench.action.toggleActivityBarVisibility |
| ⌘Q | Quit VS Code | workbench.action.quit |
| ⌃J | Join Lines | editor.action.joinLines |
| unassigned | Transpose characters around the cursor | editor.action.transpose |
| unassigned | Transform to Uppercase | editor.action.transformToUppercase |
| unassigned | Transform to Lowercase | editor.action.transformToLowercase |
发布主页:http://code.visualstudio.com/updates
历史版本 :
Visual Studio Code 1.19.2 发布,修复三个问题
Visual Studio Code 1.19 发布,性能改进
Visual Studio Code 1.18.1 发布,修复了部分问题
Visual Studio Code 1.18.0 发布了,蓝色 logo 回归
Visual Studio Code v.s Atom-IDE:Web 开发哪家强?
Visual Studio Code 1.17 发布,支持 Mac 触控条
Visual Studio Code 1.16.1 发布,修复大括号匹配问题
Visual Studio Code 1.16,自动闭合 HTML 标签
Visual Studio Code 1.15 发布
Visual Studio Code 1.14 发布
Visual Studio Code 1.13.1 发布
Visual Studio Code 1.13 发布